After The Long Rally: S&P 500 Outlook
Thanks to a subscriber for this report from Deutsche Bank which may be of interest. Here is a section:
The trajectory of the S&P 500 has been extremely closely tied to that of earnings during the course of this recovery and remains so. Following the ECB’s move to negative rates in mid-2014 and the subsequent dollar and oil shocks, earnings growth First slowed then turned negative and equities became range bound for a year and a half. In the context of the trend channel, the range bound S&P 500 moved from the top to the bottom of the trend channel, falling briefly below during the Q1 2016 growth scare and the trough in earnings. Following the Q1 2016 bottom in earnings, equity prices began to rise, briefly breaking their 1½ year range to reach a new peak in mid-2016; then paused as is typical in the run up to close Presidential elections before rebounding strongly after.
The trajectory of the S&P 500 year to date has continued to closely track that of earnings. Indeed the market rallied in the first half of the year only during earnings seasons which saw well above average beats and paused between reporting seasons. Trailing earnings were up 10% through Q3, held back in the quarter by the impact of the unusually severe hurricane season, while our estimate is for 12% growth through Q4.
The S&P 500 trailing multiple meanwhile fluctuated in a relatively narrow range of 3.5% until September before moving up by a modest 2%. The rise in the multiple in late September though is consistent with the market simply looking through the impact of the hurricanes on earnings, ex which they would have grown for a third quarter in the solid double digits.
Here is a link to the full report.
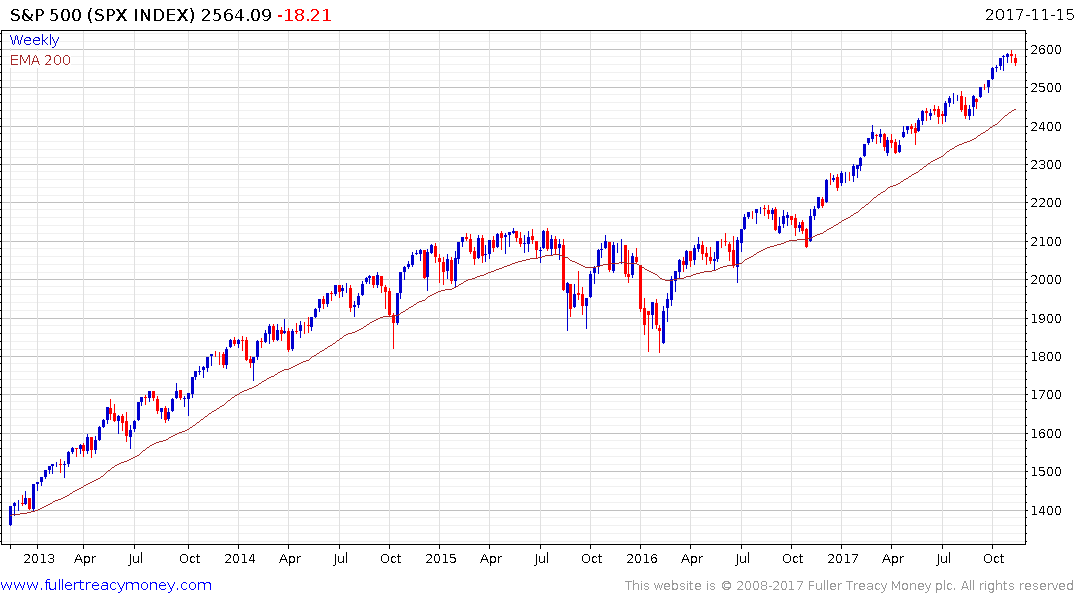
In the normal run of a trend we expect the consistency to improve as it progresses. The simple reason for this is that as buy and hold investors are vindicated in their resolve available supply decreases, meanwhile continued headlines about stellar persistent performance encourages more people in off the side-lines. The gap between supply and demand expands and the trend therefore becomes more consistent.
Between 2012 and 2014 the S&P500 trended much more consistently higher than in the prior three years. The realisation that QE3 was relatively open ended contributed to the belief that as long as the Fed’s balance sheet was expanding so would asset prices. That portion of the trend ended in early 2015 when the Fed taper ended.

The Nasdaq’s outperformance really picked up in early 2016 when it made a higher reaction low compared to the S&P500’s lower low. The concentration of investing in big name technology shares went into overdrive at that time and remains an important influence on the market today. It was also around then that passive investing in Index ETFs emerged as a driving force while the prevalence of quantitative strategies has been more of a factor this year. Without considering the effect these factors have had on volatility they are a reflection of supply being withdrawn from the market by buy and hold investing while demand is increasing because the persistence of the trend. This is a textbook example of the trend becoming more consistent as it progresses.
Next let’s ask whether there is any evidence of trending characteristics. I suspect this is a going to be a big topic at The Chart Seminar on Thursday and Friday but beyond short-term overextensions relative to the trend mean the answer is no.
The most important thing to remember is that when a very consistent trend becomes less consistent, the rhythm has been upset and discord is potentially sown. It tells us that the imbalance between supply and demand is no longer as impressive as it was previously. Within the context of the Index’s trend this year reactions of approximately 80 points have been ‘normal’ and a downdraft of more than that would be required to begin to question the consistency of the move. However, the risk of a reaction of that size is increasing as uncertainty about the fate of US tax cuts persists.
Back to top


