Down But Far From Out
Thanks to a subscriber for this report from Jefferies which may be of interest to subscribers. Here is a section:
Gold prices may have peaked in 2013 but so did the balance sheets and debt loads of the gold miners within our coverage, as the companies chased M&A and project development. Throughout 2015, and in particular 2016, the industry as a whole made FCF generation and balance sheet deleveraging high priorities. As seen below, the net debt balances of the gold miners under our coverage have declined 47% since the peak while Net Debt/EBITDA has improved by a full 1x turn, despite an average gold in 2016 that was 12% below the 2013 average.
The industry-wide focus on cost cutting and FCF generation has created companies that are less levered plays to rising gold prices, as was the case in the run up to peak gold prices in 2013. Industry FCF generation, as measured by our coverage universe, has improved greatly in the last few years. Despite much higher gold prices in 2012/13 (averaging $1,540/oz), FCF was negative as both capex and operating costs were significantly higher than current levels. As mentioned above, an industry-wide focus on FCF has clearly shown in the last few years. We forecast 2016E FCF in our coverage universe to exceed $4bn, the highest figure since the turn of the decade.
Here is a link to the full report.
Gold miners are much more leveraged to the gold price today than they have been in a very long time. They have slimmed down budgets, are eschewing spending on new projects and therefore any improvement in gold prices is reflected in free cash flow.

Gold’s persistent decline in the last two months of 2016 represented a major inconsistency in what could previously have been argued was a medium-term recovery trajectory. A reversionary rally is now underway but a number of conditions will need to be met before we can conclude demand has returned to dominance beyond short-term steadying.
It will need to demonstrate support coming in at a higher level following the first significant pullback. That would at least tell us traders are unwilling to wait for fresh low to initiate longs and cover shorts. It needs to sustain a move back above the trend mean and more importantly the $1300 area to break the six-month progression of lower rally highs which would cause a short-the-rally strategy to fail.

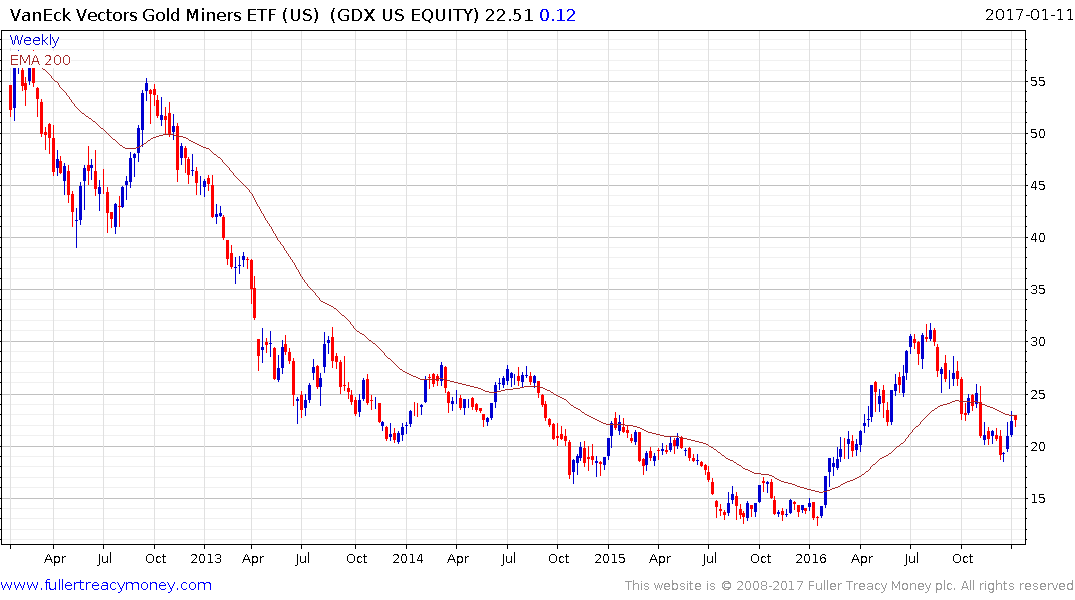
The VanEck Vectors Gold Miners ETF (GDX) has already closed an overextension relative to the trend mean which highlights the sector’s leverage to the gold price. It needs to at least hold the $20 area on the first significant pullback and also sustain a move above the trend mean to signal a return to demand dominance beyond the short term.


