Insights in 140 Words for May 29th 2014
Thanks to a subscriber for this edition of Deutsche Bank’s weekly snapshot on topical issues. Here is a section on Treasuries:
What’s behind the relentless rally in Treasuries this year? Ten year yields have fallen 60 basis points since January and are approaching 12 month lows. Half the spike following the taper tantrum has now been retraced. Explanations abound. Some focus on marginal demand, for example Chinese buying via Belgium (note the falling renminbi), short-covering or a rotation into bonds as equities reach new highs. Others make a relative value argument: widening spreads versus Bunds, a lower terminal Fed funds rate, weak US first quarter data. But few mention falling supply. A shrinking US deficit means less Treasury issuance. Indeed year-to-date net issuance is down 60 per cent from 2013. And at $490bn this year, the deficit is forecast to shrink by another $200bn, nearly matching the reduction in Fed buying. Investors just can’t get enough of US Treasuries - quite literally.
The fact that the US Treasury is issuing less debt is a topic discussed regularly in the Subscriber’s Audio. This chart of the Fed’s balance sheet illustrates how it has continued to increase despite the Fed’s tapering over the last six months. At least part of the reason the Fed has been able to taper is because there are fewer bonds being issued for it to buy.

Interestingly, the last two weeks are the first time the Fed’s balance sheet contracted on consecutive weeks in more than a year. Two weeks and a mild contraction do not make a trend, but this index is worth watching considering how dependent on liquidity the stock market has become.

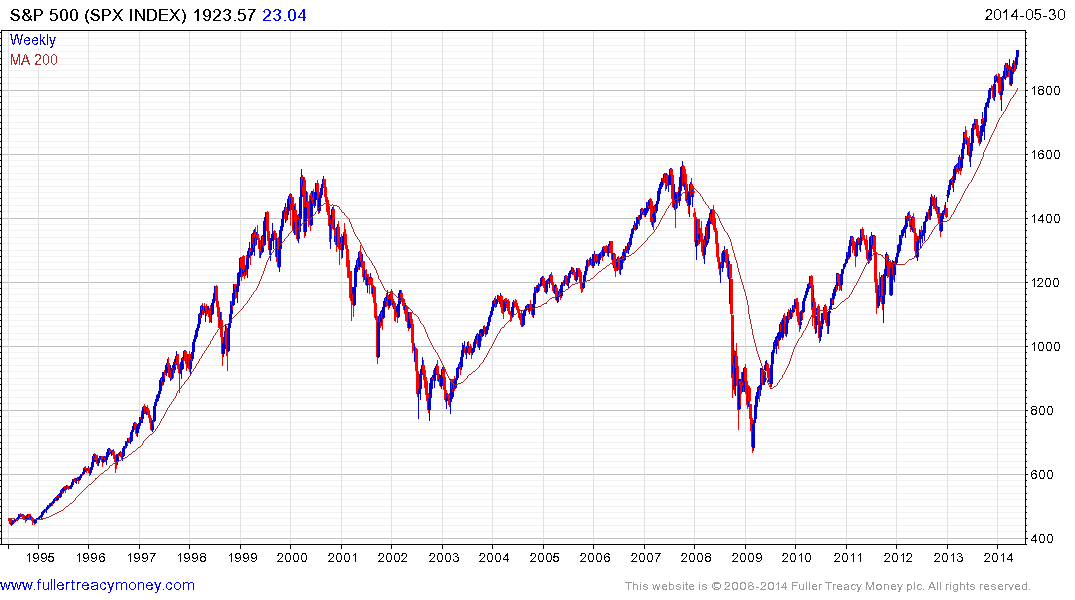
The S&P 500 has been hitting new all-time highs this week as it breaks up out of a three-month range. Having cleared 1900 the next obvious psychological resistance area is 2000. It is open to question whether investors will be willing to bid it up to that level. Nevertheless, the short-term technical action remains positive and a clear downward dynamic will be required to check momentum and signal mean reversion.
It remains our belief that the impressive five-year uptrend is maturing and that the shakeouts in biotech, small caps, new tech and IPOs generally, the move into quality and the return to favour of cyclicals are late in the cycle phenomena. However the majority of investors are likely to wait until they have clear evidence of trend deterioration before altering positions. From an emotional perspective, many investors found that they underperformed last year by being too cautious and are not willing to make the same mistake twice.
Share buybacks are hitting new all-time highs. This has been a powerful tailwind for share prices over the last few years. However, when McDonalds announced this week it would spend $20 billion in the next 18 months to buy back shares and increase dividends, its shares fell because investors were hoping for more. The incremental benefit of share buybacks appears to be decreasing.

The Powershares Buyback Achievers (PKW) ETF hit a medium-term peak relative to the S&P500 late last year and has returned to test the region of the 200-day MA. This is not the first time the ETF has underperformed and a sustained move below the MA will be required to signal a medium-term relative peak.
Back to top


