
Mike Lenhoff: Wall Street's breath reflects Main Street's recovery
This year's action on Wall Street is not just impressive; it is spectacular! We are not talking just about the S&P 500's climb to a new post-Lehman crisis high but about the breadth of the equity market and the performance of the second liners and smaller companies. The rise by the S&P mid caps to new record highs has not gone unnoticed. Nor has the rise in the S&P mid cap index. The index has climbed to within a whisker of the record set last year. The interesting feature though is that the US equity market is on its own in demonstrating such breadth. Neither the FTSE World ex US mid cap index nor the small cap index is any where near its former peak.
It is not stretching the imagination to say that the US equity market's breadth reflects the transfer of the recovery in the US economy from the corporate sector to the personal sector by way of employment. The firm upward trend of job creation is a convincing sign of the sustainable expansion the economy now looks to be establishing.

David Fuller's view This year's gains to date on not only Wall
Street but also for most other stock markets come as a welcome surprise, even
for Fullermoney which increasingly looked for a cyclical bull trend from October
2011 onwards, while also talking about the greater possibility of a melt-up
rather than the widely feared meltdown.
(See also this comment from October
27th, now in the public Archive as are Audio recordings released at least
four months ago.)
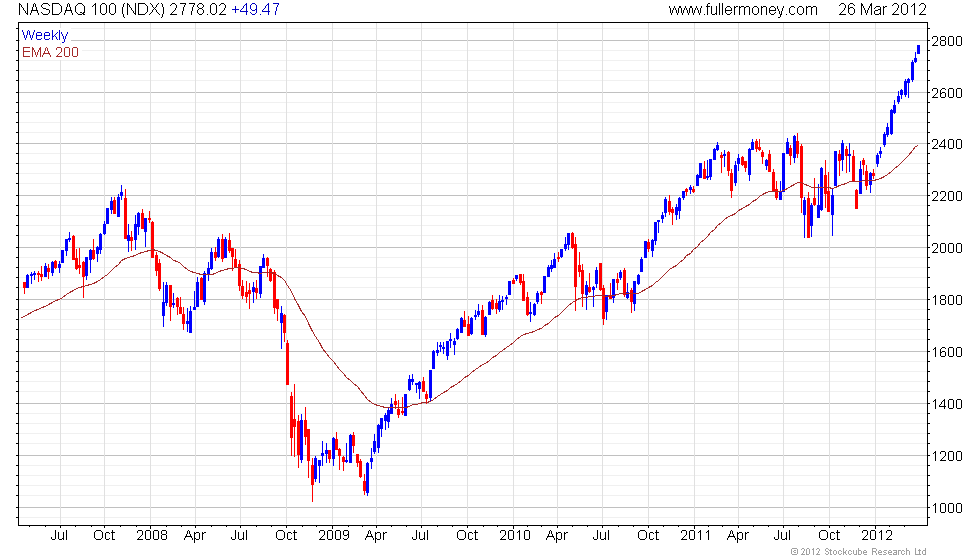
Amazingly,
the Nasdaq 100 Index (weekly & daily)
is in its 13th consecutive week of gains. While this is unusually persistent,
it is not irrational given that the Index ranged throughout 2011 in building
what many regarded as a large top formation. Instead, it has proved to be a
launch pad for this year's advance.
A pullback
beneath last Friday's low and the small range evident above 2700 on the daily
chart would now be required to question upside momentum beyond a short pause.
We can expect this advance to lose momentum in coming weeks but without a major
catalyst such as a potential spike in oil prices (Brent
& WTI) - a definite risk judging
from these charts - downside risk is unlikely to extend beyond a somewhat bigger
reaction and consolidation within this cyclical bull market.