
The unweighted Continuous Commodity Index,

David Fuller's view also
known as the Old CRB (historic,
weekly & daily)
is currently steady near its 2008 peak and a close beneath 550 would be necessary
to indicate more than temporary resistance near present levels.
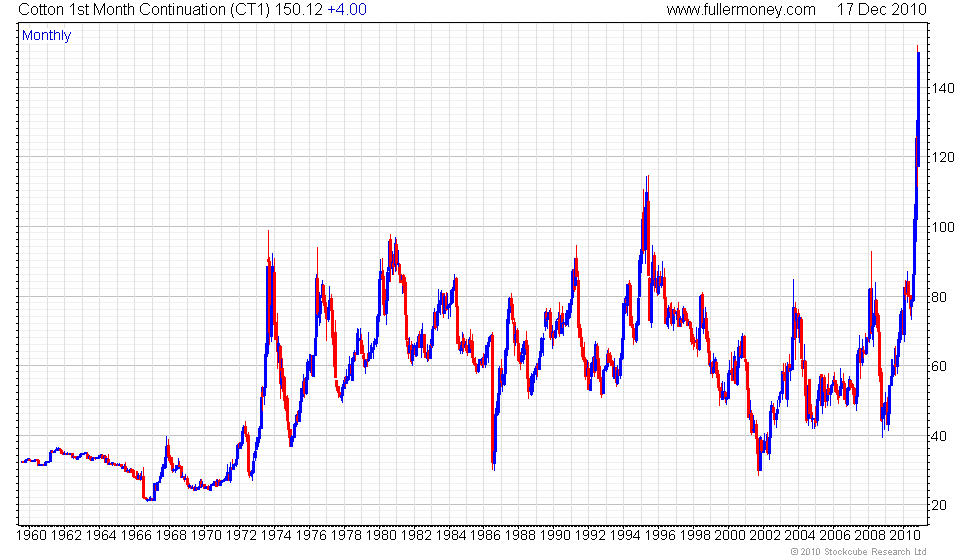
Cotton
(historic, weekly,
daily & inflation-adjusted)
has seen one of the most dramatic rises and is testing its November high. Back
then, a key day reversal marked the turn and another similar downside dynamic
would be required to indicate more than temporary resistance near current levels.
Gold
(weekly & daily)
remains in a mean reversion towards its medium-term trend represented by the
200-day moving average. It also experienced a small downside key day reversal
following the new high in early December. A break in the recent progression
of higher reaction lows, with the last one at $1330 in mid-November, would suggest
a somewhat larger pullback before the overall upward trend is resumed.
Government
bonds, including 30-year
T-Bonds, plus 10-year JGBs, Euro
Bunds, Gilts, Australian
and Canadian long-dated bond futures
all became short-term oversold recently and technical rallies have commenced.
Given the top building that has occurred (see also weekly charts and the corresponding
base building in yields), these rallies are unlikely to retrace more than a
third to half of the recent declines, at best. Watch for the next downward dynamics
to signal renewed selling pressure.