Interesting charts September 5th 2023
I have decided to reintroduce this feature because I cannot possibly cover every noteworthy chart in the daily commentary.
Dow Jones Industrials Average – downside key reversal on Thursday and beginning to follow through on the downside. That suggests a peak of at least near-term significance.
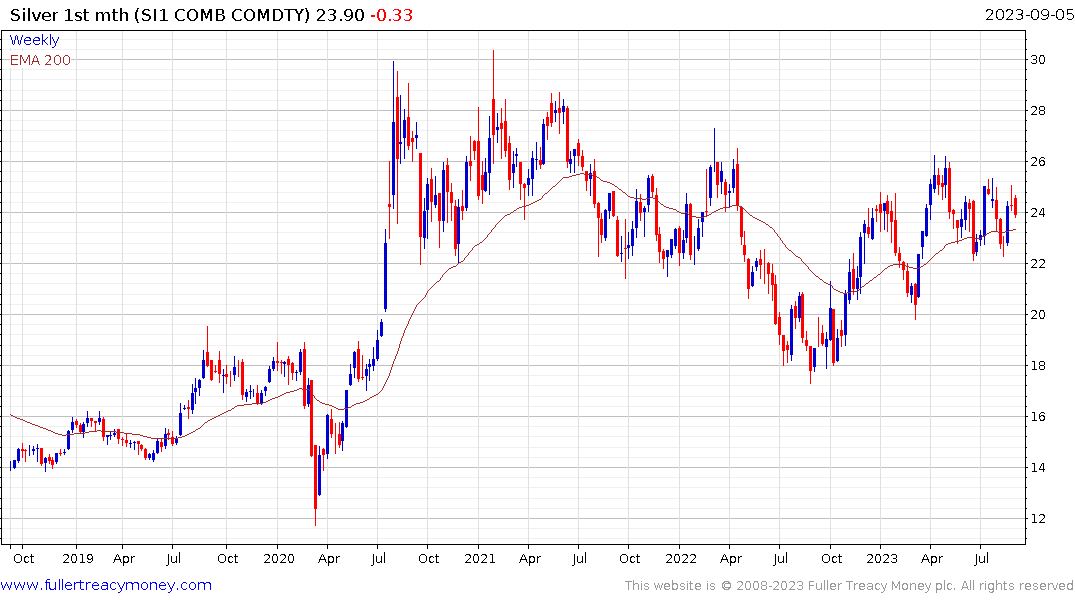
 Silver – encounters resistance in the region of the July peak and is now approaching the 200-day MA.
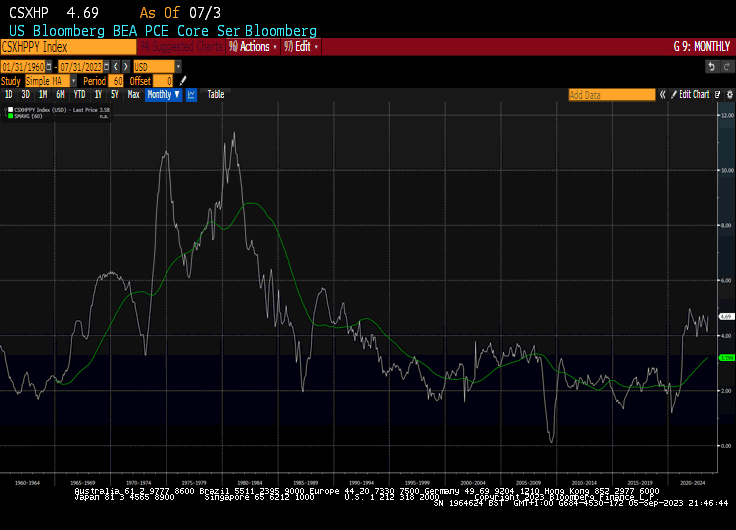
Core Services ex-housing inflation is still holding above 4% so that implies further rate hikes and more volatility in precious metals.
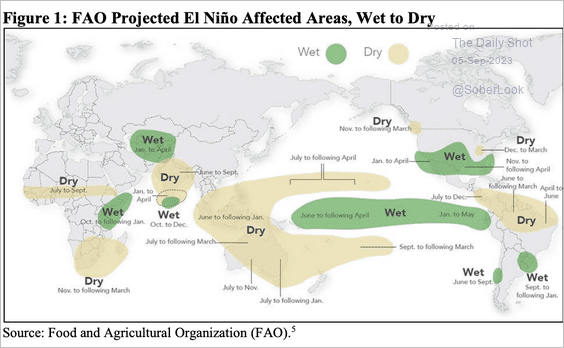
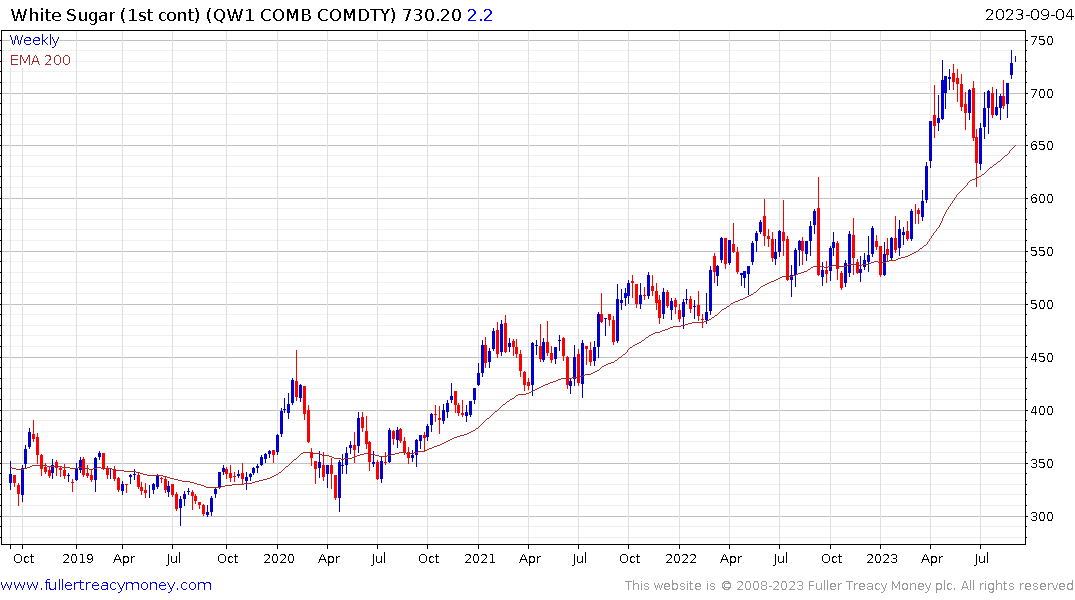
 Sugar – El Nino beginning to hit harvests in both Brazil and India. The price is breaking out of the most recent range to hit new recovery highs.
Rubber – continues to extend the rebound from the lower side of the three-year range and has clearly broken the 12-month downward bias.
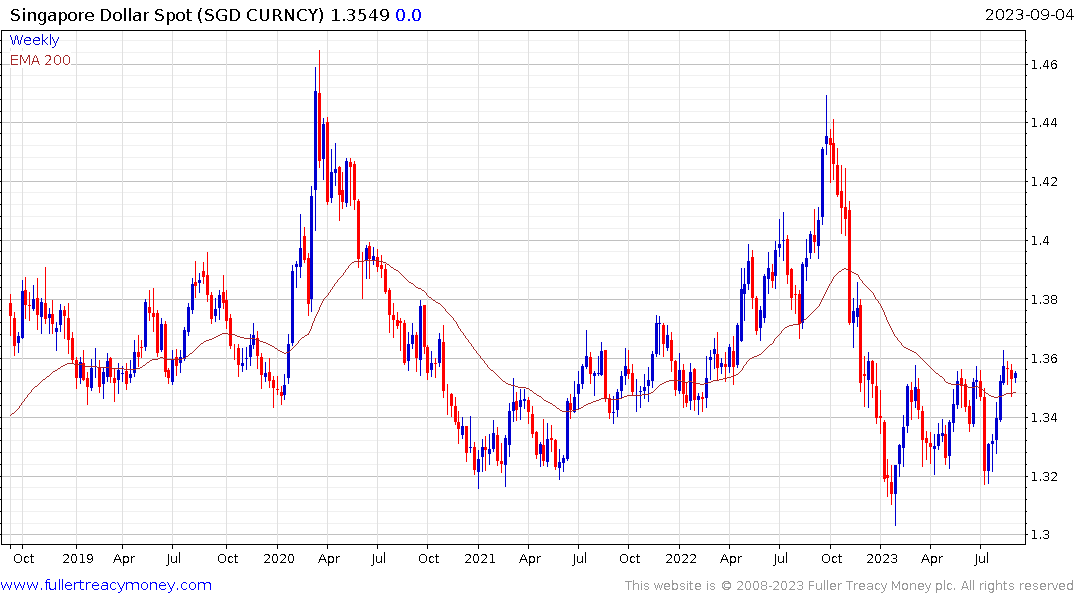 Singapore Dollars per 1 US Dollar – The USD is breaking out of a 9-month base formation within a broad eight-year range. There is ample scope for additional upside.


