
Today's interesting charts

David Fuller's view Price
trends, both current and historic, provide investors with not only perspective
regarding timing, but also the relevance of any market opinion.
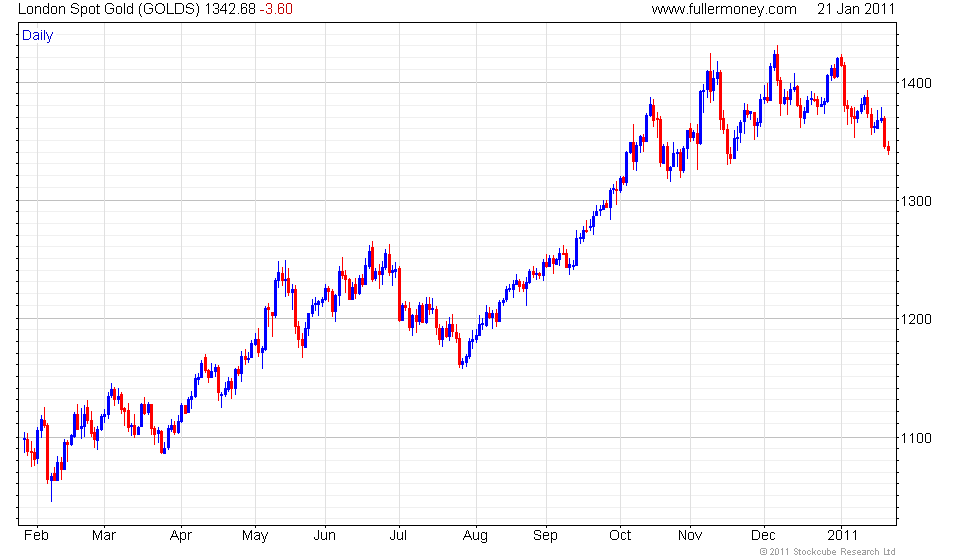
Gold
bullion (weekly
& daily) has seen three failed breaks above $1400
since last November, with the peak at $1431.25 on 7th December occurring on
a key reversal day. This loss of upside momentum and ranging appears to be a
mean reversion process back towards the medium-term uptrend approximated by
the rising 200-day moving average. A break in the progression of higher reaction
lows occurred in early January and there has been some additional erosion of
near-term support recently. A clear break in this month's sequence of lower
rally highs is now required to check the lower drift during the remainder of
this pullback and consolidation phase.
Silver
bullion (weekly
& daily) surged up out of its
long trading range in September, rallying by over 50% before the advance was
checked by a large weekly key reversal. Silver is more overextended than gold,
has now declined for the last three weeks and broke some lateral support near
$28 on Thursday. Here also, a break in the progression of lower rally highs
(best seen on the daily chart) is required to question current scope for additional
sideways to lower ranging in silver's mean reversion towards the rising 200-day
MA.
On
current evidence, upside leadership in precious metals - when it next
occurs - will be led by palladium (weekly
& daily) and platinum (weekly
& daily). However, watch the
progression of higher reaction lows on palladium (best seen on the daily chart)
as they are an import consistency characteristic for the short to medium-term
uptrend and PA is still quite overextended relative to its MA. Also, watch the
psychological $1800 level for platinum. Currently, we cannot be certain as to
whether or not palladium and platinum will pull gold and silver higher over
the next several weeks, or whether the latter two - where the bigger speculative
positions are held - will pull the current relative strength leaders lower.
Wheat
(weekly & daily)
appears to be breaking up out of its range since August, completing the first
step above the base formation. A close beneath $8.00 is now required to question
this hypothesis, and below the last reaction low near $7.60 to confirm an upside
failure. Although obviously not a technical point, the grain and bean complex
continues to benefit from its bullish fundamental tailwind in the form of low
stockpiles and uncertainty over next season's crops.
ASEAN
stock market leaders, including Indonesia (weekly
& daily), The Philippines (weekly
& daily), Thailand (weekly
& daily) and Singapore (weekly
& daily) lost upside momentum in
November and have been in a corrective phase subsequently. Only Malaysia (weekly
& daily) managed to move somewhat
higher but it is unlikely to advance on its own for very long and weakened today.
Indonesia, as the leader on the way up and also the downside more recently is
the one to watch most closely. Its mean reversion has taken it back to just
above the 200-day moving average. The rising MA is a potential support level.
However Indonesia and the other ASEAN markets will need to bounce from their
MAs and break the progressions of lower rally highs, where evident, to signal
that selling is abating and demand is regaining the upper hand.
Japan's
indices saw some downward dynamics today, as you can see from daily charts
for the Nikkei (weekly & daily),
Topix Banks (weekly & daily)
and even more clearly for the Second Section (weekly
& daily). This has checked the advance
for at least the short term and sustained moves above this week's highs would
be required offset current scope for a further reaction and consolidation of
recent strong gains.
India's
Sensex Index (weekly &
daily) has returned to an interesting
area, combining mean reversion to the MA and approximately 1000 points above
the large trading range evident below 18000. These are potential support levels
but to feel more confident about the short-term outlook I would like to see
some upward dynamics, not least from the Bombay Banks Index (weekly
& daily) which also needs to break
its progression of lower rally highs.
Nasdaq
100 (weekly & daily)
has enjoyed another terrific run since the end of last August, leading western
markets higher in the process. It looks temporarily overextended; it has faltered
in the last three days and appears due for a further reaction. A new closing
high would be required to question this hypothesis.
Report on soft commodities - My
thanks to a subscriber for this item,
relevant to Fullermoney's current interest in agricultural commodities. These
markets are discussed in some detail in the Audio.
Historic Fullermoney Archive: FM22
End February 1986 - Japan's stock market was
moving towards a leadership role in the secular bull market; you will see what
proved to be one of the greatest ever buying opportunities in Singapore and
this issue even has an upside down chart, which I wish I could say was the intentional
error. Oh, the Dickensian days of cut and paste. I was about to depart on a
seven-country Asian tour with The Chart Seminar.
Under
the headline OPEC shoots the other foot, you will see that the 'Peak Oil' theory
has been around for a very long time, only they had yet to call it that.
I discussed
my Middle East trip in FM22, particularly Turkey, and my global tours with TCS
were reaching their crescendo.
Quote of the week - On going
somewhere:
"Nobody got anywhere in the world by simply being
content."
Louis L'Amour